Articles
What’s New in IBM SPSS Statistics v31?
If you’re in the business of turning data into decisions, IBM SPSS Statistics Version 31 is built for you. Whether you’re a seasoned statistician or a data-savvy analyst, Version 31 delivers a powerful suite of new procedures and usability enhancements that deepen analytical capabilities and streamline your workflow. From advanced techniques like Proximity Mapping and Distance Correlation to intuitive upgrades that make everyday tasks easier, this version helps you uncover insights faster and with greater precision. This blog will cover:
- Smarter Statistical Tools for Deeper Insight
- New Procedures
- Easy Extension Management for New Procedures
- Usability Enhancements
Smarter Statistical Tools for Deeper Insight
Version 31 introduces several enhancements aimed at improving statistical interpretation for commonly used procedures.
Curated Assistance for Correlations: Obtain an intuitive summary of your correlation table for Bivariate, Partial, Distance, Canonical, and Linear Regression correlations. The summary is displayed below the correlation table and categorizes correlations as Highly Positive, Positive, No Linear Correlation, Negative, and Highly Negative. This categorization includes colour coding, also reflected in the table, facilitating rapid interpretation of coefficients.
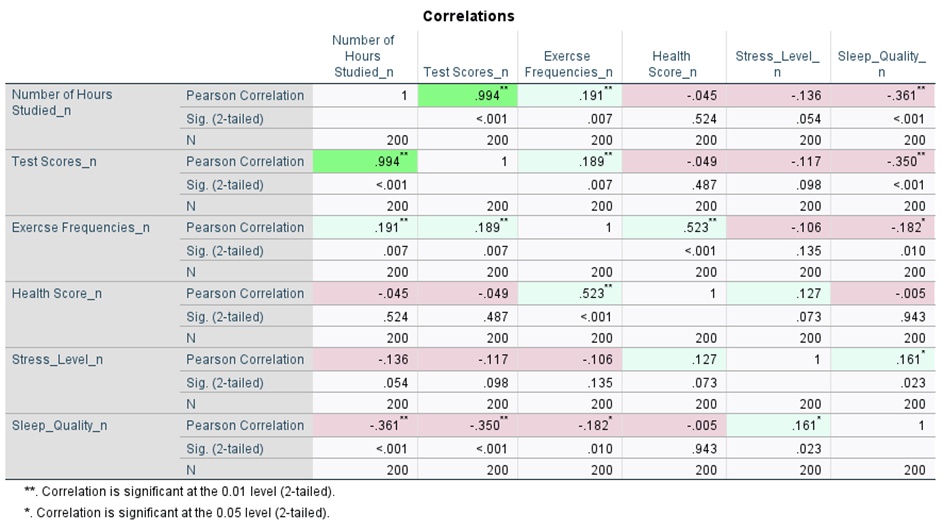
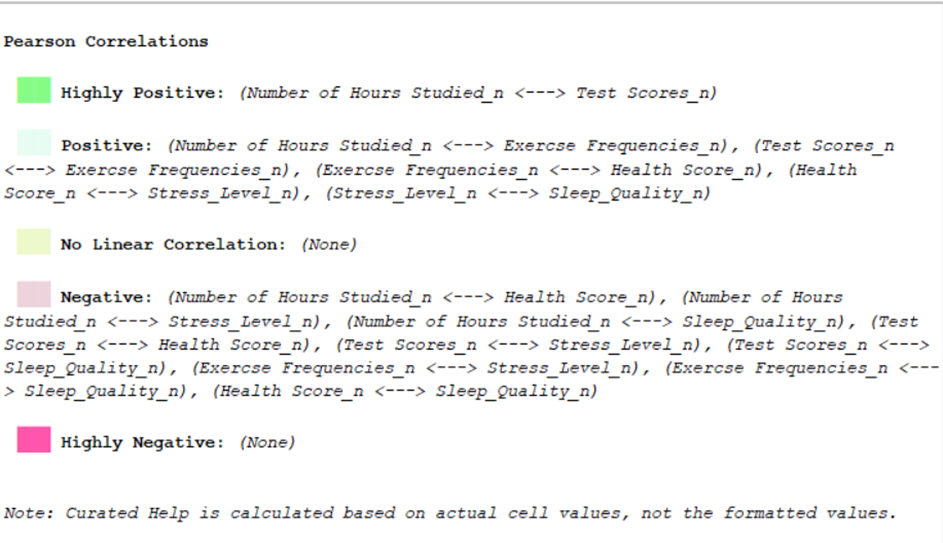
Customisable Correlation Tables:
Quickly reformat correlation outputs using a built-in script. To perform this action, execute the correlation procedure, click on the displayed table, navigate to Utilities > Run Script, and select IBM SPSS Statistics/Resources/Scripts/Reformat Correlations Table.py. This will create a more readable and compact table.

Chi-Square Test Menu Option:
Quickly assess relationships between categorical variables. To obtain the test go to Analyze > Descriptive Statistics > Chi-Square. The test evaluates whether the observed frequencies in the data differ from the expected frequencies under the null hypothesis, which assumes no association between the variables. This procedure provides a case processing summary with the Chi-Square test result. Users can still run Crosstabs with Chi-Square tests if necessary. The Crosstabs procedure is also located on the Descriptive Statistics menu.

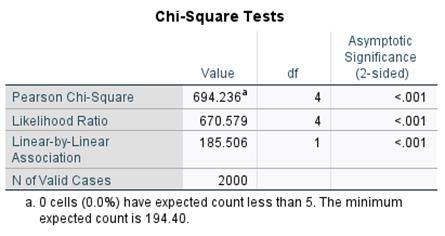
Coefficient of Variation:
The Coefficient of Variation is now available for statistical outputs. This feature has been added to both Frequencies and Descriptive Statistics to facilitate dispersion analysis. To obtain the Coefficient of Variation, click the Statistics button in the Frequencies procedure and the Options button in the Descriptives procedure.
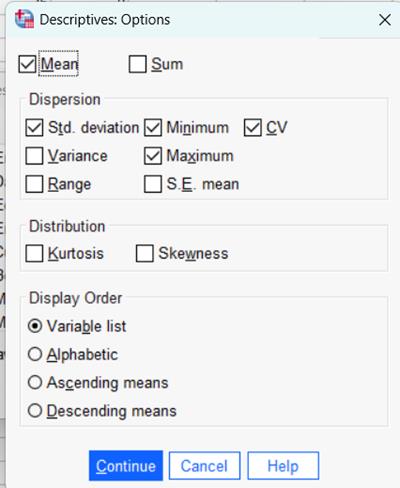
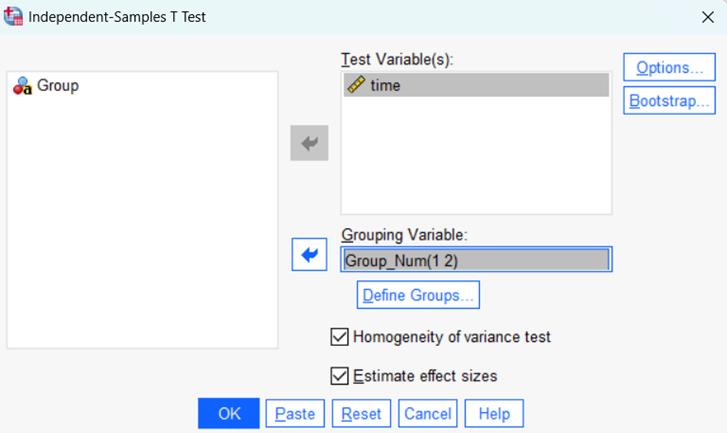
Homogeneity of Variance Control:
Users can now optionally toggle this feature during Independent-Samples T Tests. With the new control, users control whether this test appears in output.
New Procedures
Several new procedures expand the analytical toolkit within IBM SPSS Statistics.
Proximity Mapping:
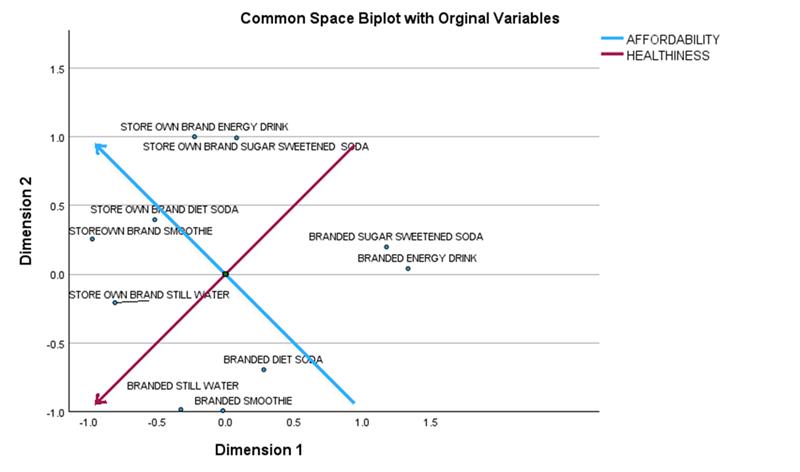
Proximity mapping is a visualization technique that spatially organizes multivariate data, revealing the relationships among various objects. Proximity mapping groups similar items while separating dissimilar ones, making patterns within relational data clearer. The PROXMAP procedure in IBM SPSS Statistics offers greater flexibility compared to PROXSCAL and can handle diverse input types and multiple sources of proximity data. To use Proximity Mapping, go to Analyze > Mapping > Proximity Mapping.
Distance Correlation:
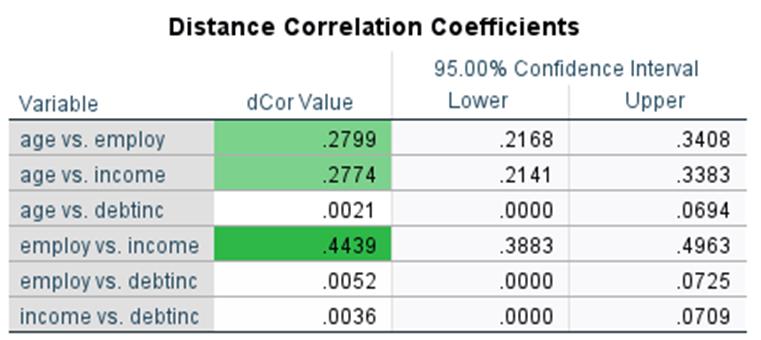
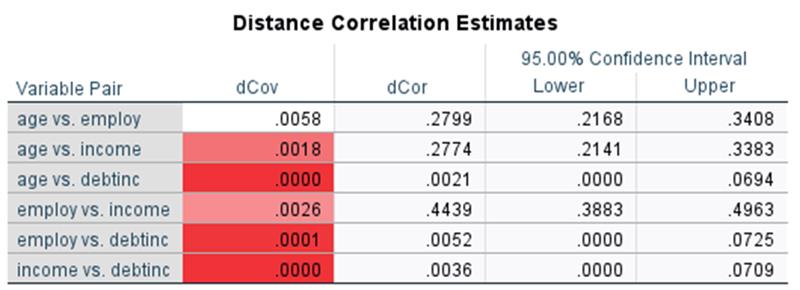
Distance Correlation detects both linear and nonlinear dependencies, does not require the normality assumption, supports multidimensional data, can demonstrate variable independence more directly than Pearson correlation, and assists with feature selection. It is accessible via Analyze > Correlate > Distance Correlation.
Time Series Filters:
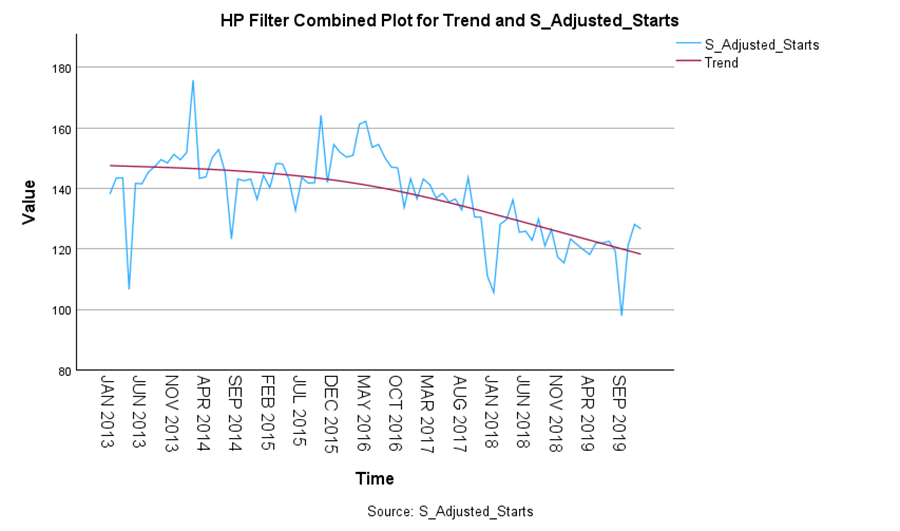
These filters decompose time series data into trend and cyclical components using methods such as the Hodrick-Prescott, Baxter-King, and Christiano-Fitzgerald filters. These tools reduce noise, highlight key patterns, and support trend, seasonality, and residual analysis. They can assist with preparing data for modelling or forecasting. To run a time series filter, go to Analyze > Forecasting > Time Series Filters. Ensure that this procedure is downloaded and installed from the Extensions menu prior to use.
Conditional Inference Trees (CIT):
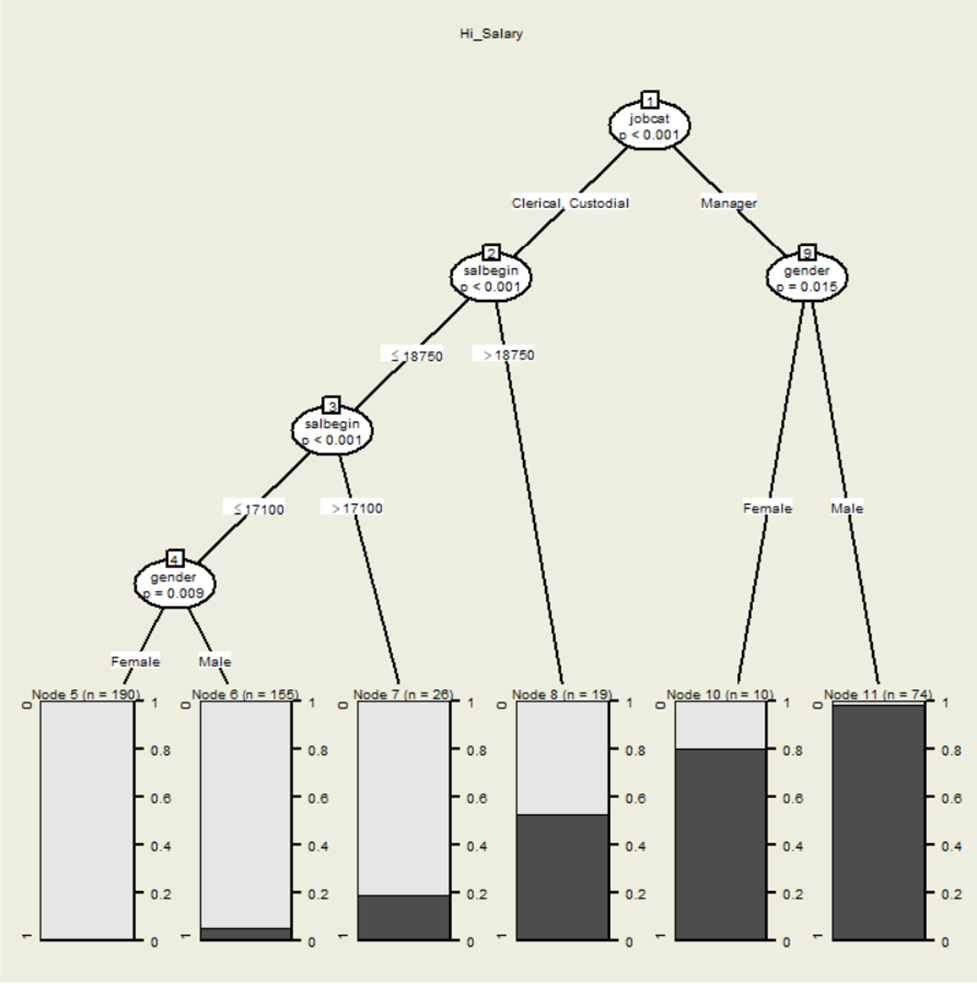
These trees offer a statistically robust alternative to traditional decision trees, reducing overfitting and enhancing interpretability with statistical tests for splits. They improve stability and provide clear outlines and plots. Users can build Conditional Inference Trees and Model-Based Trees (MOB). To create a Conditional Inference Tree, go to Analyze > Classify > Conditional Inference Tree. Ensure that this procedure is downloaded and installed from the Extensions menu prior to use.
STATS EARTH:
STATS EARTH a non-parametric regression method aimed at modelling complex, nonlinear relationships between predictors and an outcome variable. It employs hinge functions, piecewise linear segments that activate beyond a threshold, to flexibly represent changes in these relationships. The algorithm operates in two phases: a forward pass to add basis functions for better model fit and a backward pass to prune the model, avoiding overfitting. This results in a sparse, interpretable model that effectively captures essential nonlinearities and interactions without manual adjustments, making it ideal for high-dimensional or complex data. To run STATS EARTH, go to Analyze > Generalized Linear Models > Multiple Adaptive Regression Splines. Ensure that this procedure is downloaded and installed from the Extensions menu prior to use.

Easy Extension Management for New Procedures
Time Series Filters, Conditional Inference Trees, and STATS EARTH are Extensions and must be installed from the Extensions menu prior to utilization. These Extensions can be effectively managed and installed through the Extensions menu.
With this menu, users have the capability to locate, download, install and uninstall over 150 analytical, data manipulation, presentation and visualisation procedures. Upon installation, users will receive instructions on how to access the newly integrated procedures. To find Extensions, navigate to the Extensions menu and select Extension Hub. This will open the Extensions Hub. Here users can search for programs and tick ‘Get Extension’ to download and install the new program.
Usability Enhancements
Version 31 also includes further usability enhancements.
Add background images to charts:
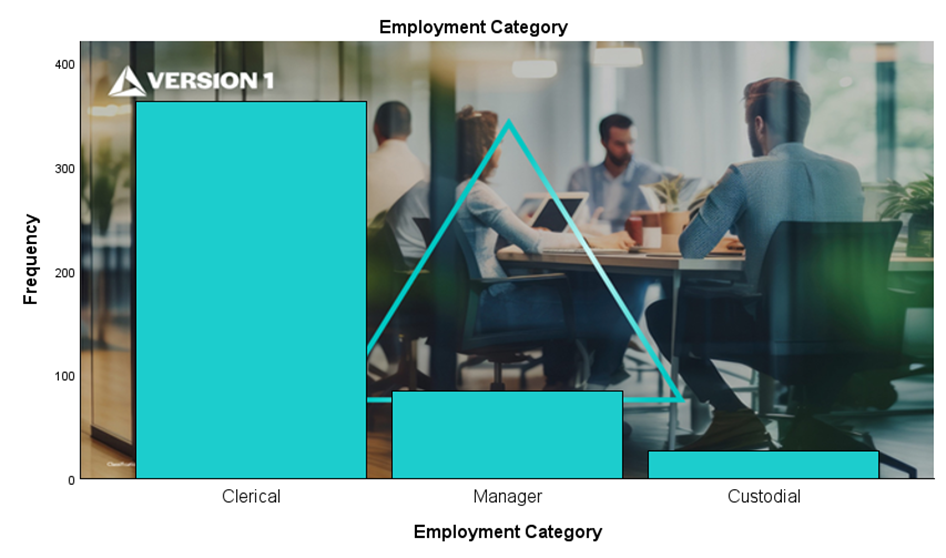
To enhance the visual appeal of charts, users can add background images. This can be achieved by running the chart and double-clicking it to open the Chart Editor. Within the Chart Editor, users can click on the background and select the Properties Window, Fill and Border, and select Fill Image. Users can then browse for the desired image.
Set default column width:
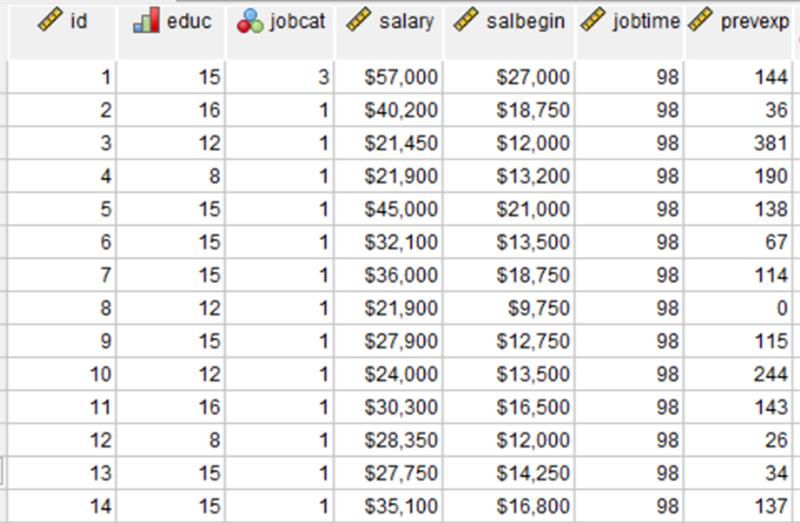
Users can configure a column width once, and it will remain for future sessions. Below the variable ‘salbegin’ appears in a column that needs adjustment. After adjusting and closing the program, the change persists into the next session.
Adjusting Common Properties for multiple variables:
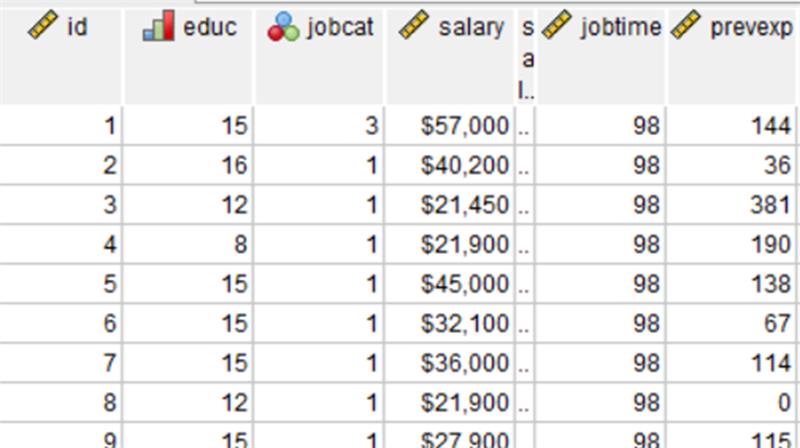
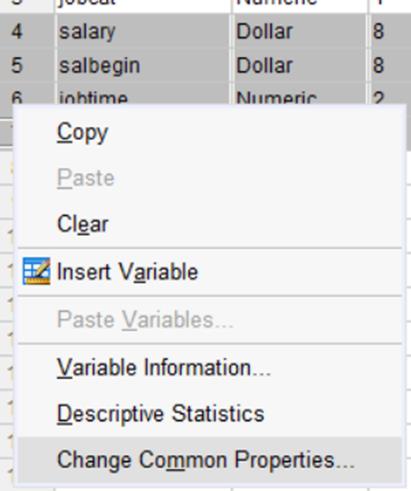
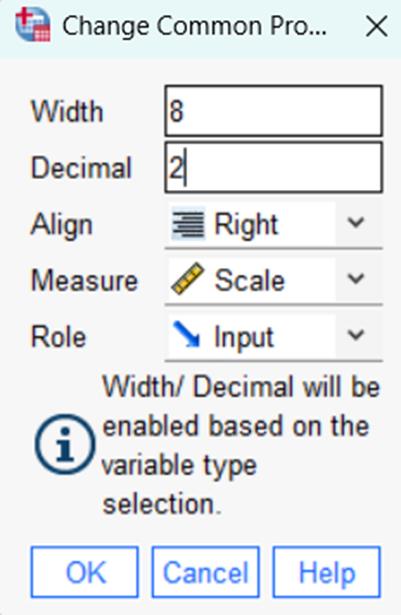
In the Variable View, users can modify multiple variables simultaneously to ensure accuracy and save time. Highlight the variables to change, right-click, and select Change Common Properties. This applies changes to all selected variables. In the example below, four variables were selected so that their properties could be changed together, ensuring fast and consistent data typing.
Enhanced Status Bar:
When users run the Select Cases procedure, unselected cases are filtered from the dataset visually. The status bar now displays the number of selected cases, providing additional information to assist with data understanding. In the example below, a filter is applied to the data to select ‘Managers’. The enhanced status bar shows that 84 cases or Managers are selected.

View Unlicensed Features:
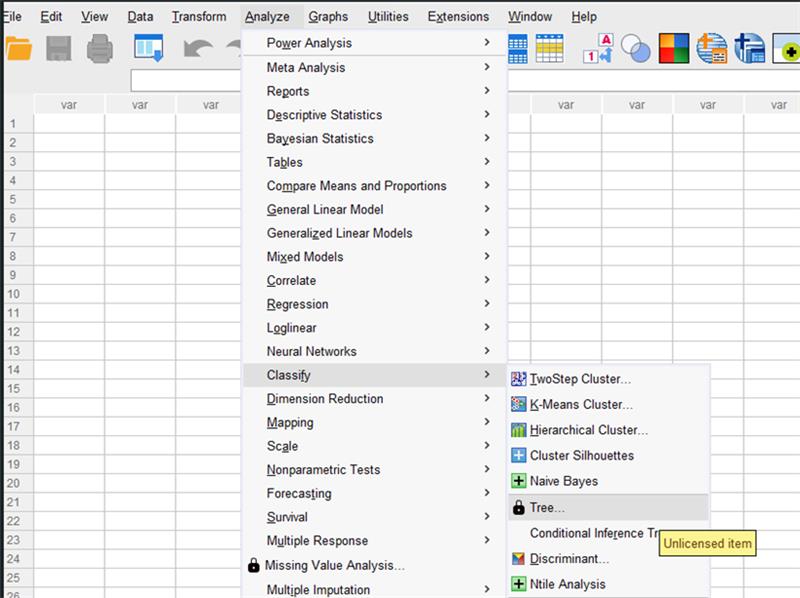
Users can now see unlicensed features marked with a lock in the menu. Clicking on the locked procedure provides more information.
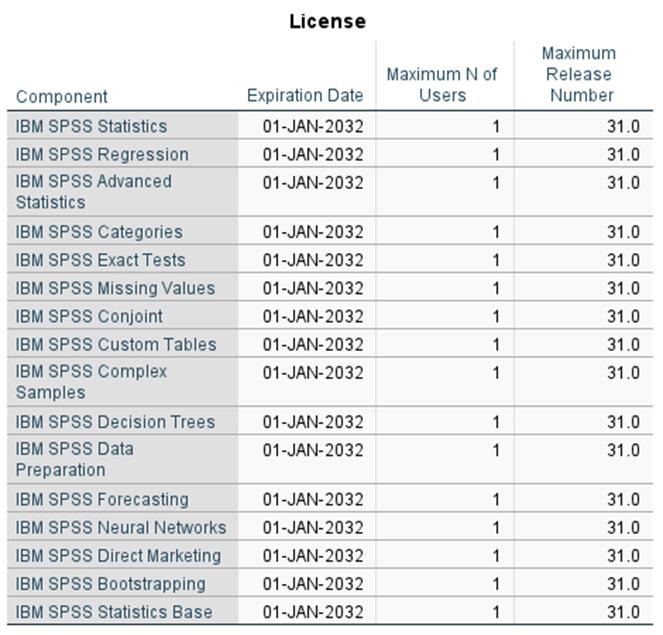
License Information Available in Help Menu: Users can access the Help menu and select Show License Detail to view their modules. This will show the Component, Expiration Date, Maximum Number of Users, and Maximum Release Number.

Create Output Themes:
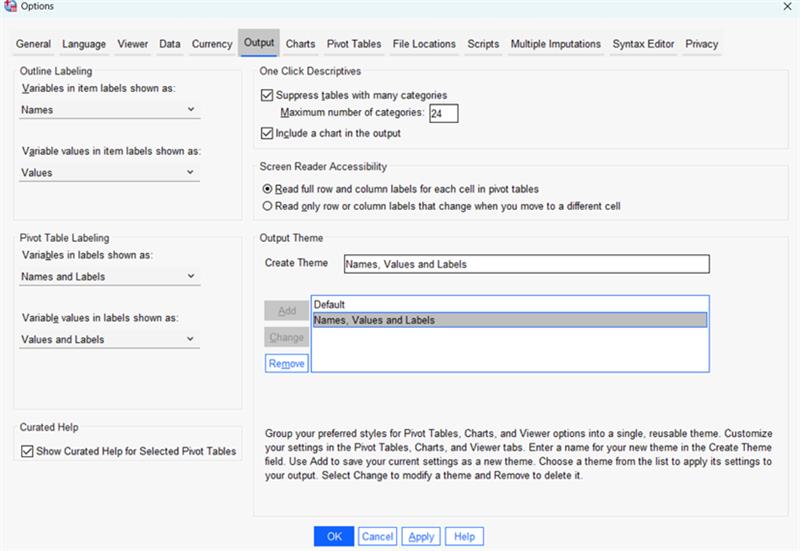
Users can now create Output Themes in the Options dialog box. Using this option, users can create custom styles for pivot tables, chars and viewer output. Users can also create multiple themes and select these as needed. To create a custom theme, go to Edit > Options and click Output tab. In the Output Theme area, you can Add, Change or Remove themes.
Mandatory input fields highlight:
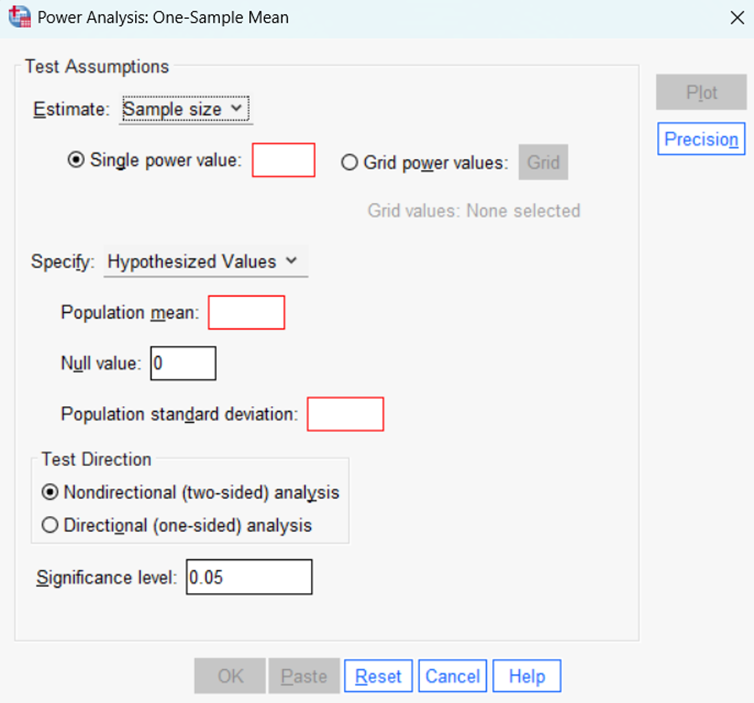
Mandatory inputs are highlighted red in Power Analysis, Meta Analysis, and Reports making the inclusion of mandatory information for these procedures.
Summary
IBM SPSS Statistics Version 31 introduces a robust suite of enhancements that elevate both analytical depth and user experience. This release combines smarter statistical tools, such as curated correlation summaries, customizable tables, a new Chi-Square menu item, and Coefficient of Variation options, with powerful new procedures like Proximity Mapping, Distance Correlation, Time Series Filters, Conditional Inference Trees and STATS EARTH to deliver maximum analytical flexibility.
With streamlined extension management and usability upgrades like persistent column widths, enhanced status bars, and customizable output themes, Version 31 empowers users to work more efficiently while uncovering deeper insights from their data.
Version 1’s experienced consultants are on hand to help you understand your SPSS needs – from consultancy and training to finding the best software and license type for your analytical and usage requirements. Contact us to discuss your requirement and identify the best SPSS solution for you.
Related Articles
Take a look through our SPSS Articles covering a broad range of SPSS product and data analytics topics.


