Articles
What’s New in IBM SPSS Statistics v29?
Looking to quickly learn what’s new in IBM SPSS Statistics 29? Rather than reading a list of changes and new procedures, there is a quick way to tour what’s new and access help.
Let’s Take a Tour of What’s New in IBM SPSS Statistics
To get started with your tour, go to the File menu, and select the Welcome Dialogue option.
On the right side of the Welcome Dialogue box is a What’s New section (see below). Here you can click through new features in IBM SPSS Statistics.
Violin Plots
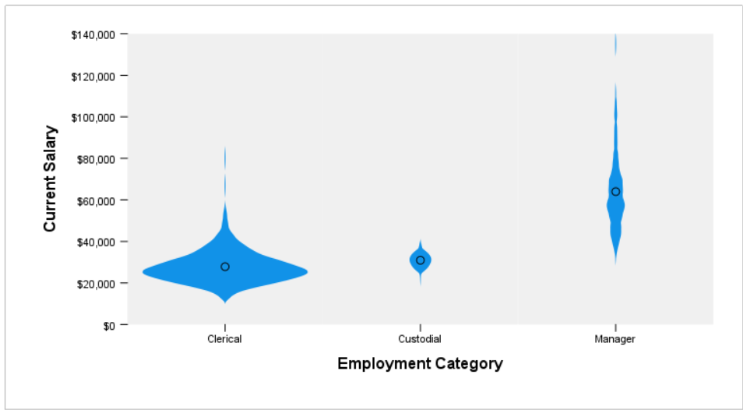
Violin plots are new in version 29. There is a brief description of these plots and an example in the Welcome Dialogue box.
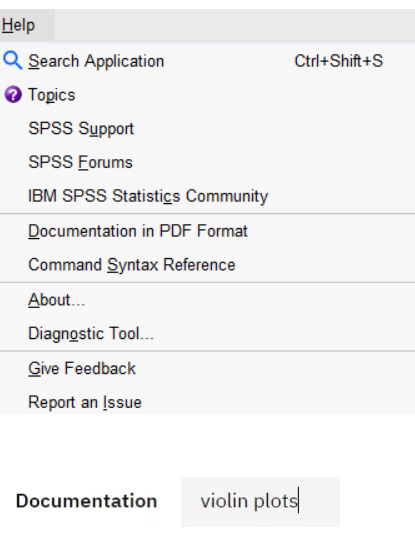
Don’t forget that help is always at your fingertips in IBM SPSS Statistics. When running violin plots or any other procedure, you can go to Help menu and select Topics. You can enter your topic of interest in the Documentation search box at the top.
There are other changes in version 29. To see more new features, click on the arrows on either side of the violin plot. If you click on the arrow to the right, you will see the next new feature.
Parametric Survival Models
Parametric survival models are new in version 29. These models assume that survival time follows a known distribution and fit. They fit accelerated failure time models with model effects proportional to survival time.
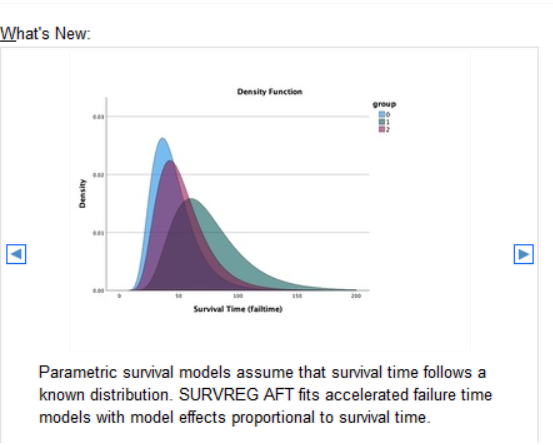
To start using these models go to the Extensions menu and select Extension Hub. In the search box enter SURVREG. You can install the extension by ticking Get extension.

To see the next new feature in version 29, click on the arrow to the right on the What’s New display.
Linear Ridge Regression
Linear Ridge regression is now available. This python-based procedure fits linear regression models with specified ridge hyperparameters, displays trance plots, or selects hyperparameter values via cross validation.
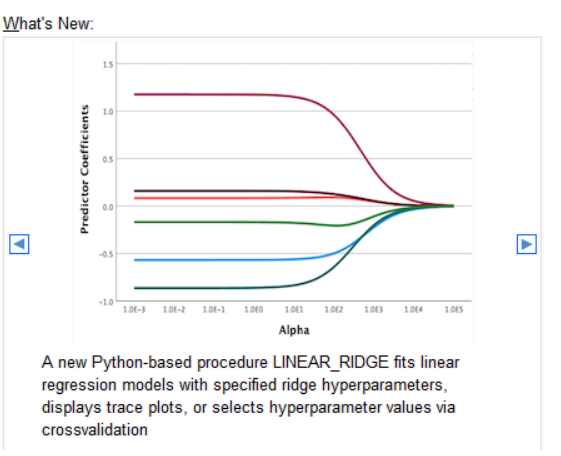
To start using these models go to the Extensions menus and select Extension Hub. In the search box enter Linear Ridge Regression. You can install the extension by ticking Get extension.

To see the next new feature in version 29, click on the arrow to the right on the What’s New display.
Linear Lasso Regression
Linear Lasso regression is another python-based procedure that fits linear regression models with specified L1 hyperparameter, displays trace plots or select hyperparameter values via cross validation.
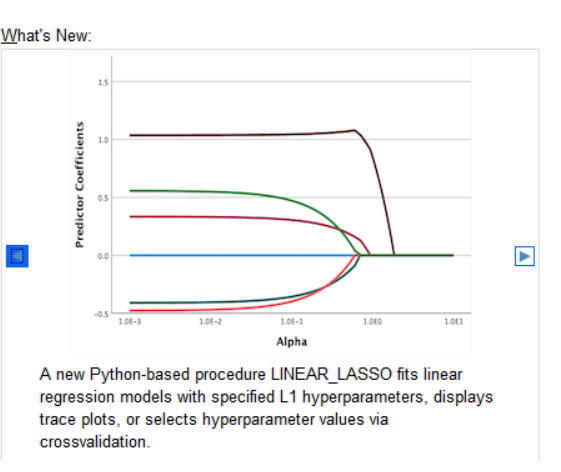
To start using Linear Lasso regression go to the Extensions menus and select Extension Hub. In the search box enter Linear Lasso Regression. You can install the extension by ticking Get extension.

To see the next new feature in version 29, click on the arrow to the right on the What’s New display.
Linear Elastic Net Regression
Statistics now has Linear Elastic Net Regression, a python-based procedure that fits linear regression models with specific L1 and L2 hyperparameters, displays trace plots or select hyperparameter values via cross validation.
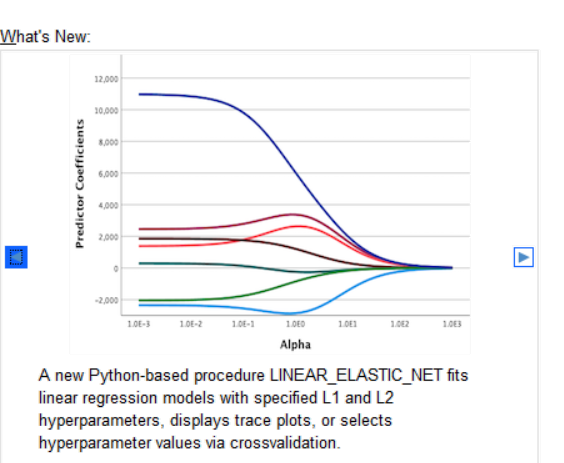
To start using Linear Lasso regression go to the Extensions menus and select Extension Hub. In the search box enter Linear Elastic Net Regression. You can install the extension by ticking Get extension.

To see the next new feature in version 29, click on the arrow to the right on the What’s New display.
Improved Messaging and Improvements in Workbooks
Version 29 now has improved messaging and usability of Workbooks.
Users can now switch between Classic syntax and output or the Workbook option by clicking on a button at the bottom right of the Data Editor. Selecting Workbook allows users to run syntax in Workbook mode.

In Workbook mode, syntax procedures appear in a window with a Run Syntax button.
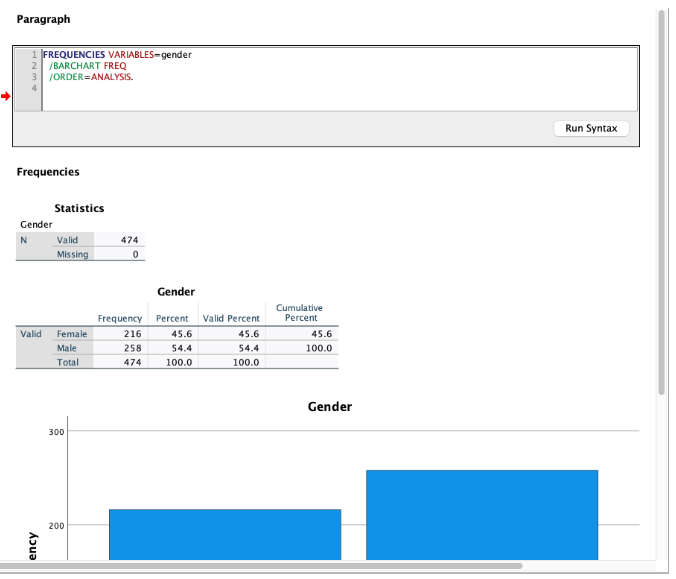
Users can click on the Clear all output button to remove output.

Users can also click on the Hide all syntax button to hide syntax.

To see the next new feature in version 29, click on the arrow to the right on the What’s New display.
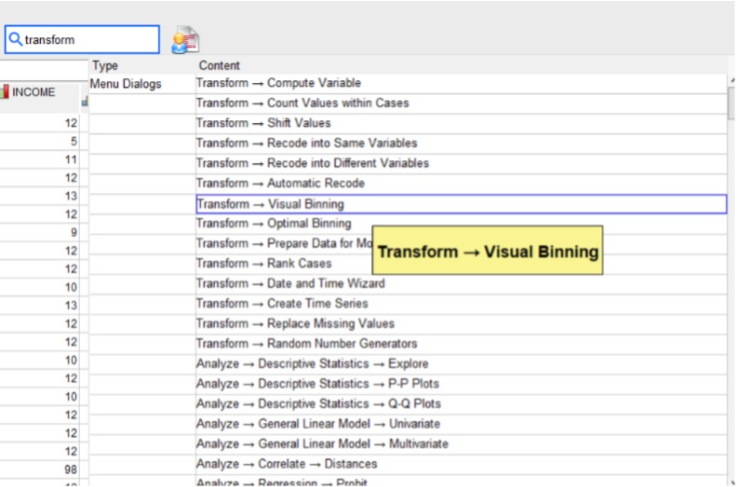
Improved Search Feature
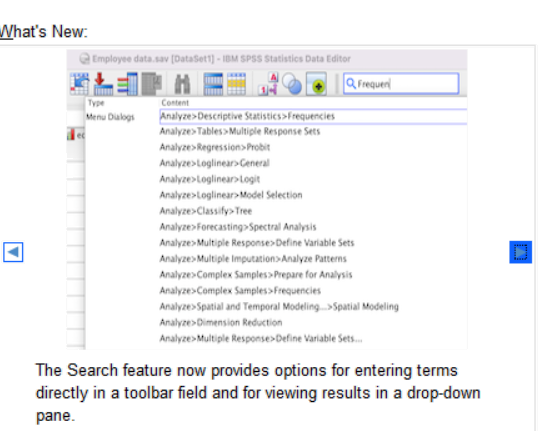
The search feature in Statistics has been improved. Users can enter a term and there is a drop-down menu to find procedures. When you click on the procedure, the dialogue box for that procedure will open.
Additional Features in IBM SPSS Statistics Version 29
Pseudo-R2 measures and the intra-class correlation coefficient are now included in Linear Mixed Models and Generalized Linear Mixed Models output (when appropriate). For more flexibility, Python 3.10.4 and R 4.2.0 are installed with Statistics. Users can work within Statistics, run Python and R code in Statistics or use the Python and R GUIs installed with Statistics.
Summary
There are multiple changes in IBM SPSS Statistics 29 with the inclusion of parametric survival models, additional regression techniques, violin plots and new features designed to make working in Statistics even easier. Python and R are included with Statistics, and the Extensions Hub provides users with access to over 60 analytical techniques that can be installed. These changes, combined with the statistical procedures already available, make Statistics a complete and comprehensive statistical platform.
Version 1’s experienced consultants are on hand to help you understand your SPSS needs – from consultancy and training to finding the best software and license type for your analytical and usage requirements. Contact us to discuss your requirement and identify the best SPSS solution for you.
Related Articles
Take a look through our SPSS Articles covering a broad range of SPSS product and data analytics topics.


