Articles
What is Analytics?
What is Analytics?
Analytics is being discussed more and more often in top table conversations, but why do so many organisations still struggle to get to grips with it? Is it fundamentally down to complexity, or at least the perception of complexity? Or even at this stage, why does it mean so many different things to so many different people? Take an ‘analyst’ for example.
The sheer diversity and variety in responsibilities for those with the term analyst in their job title might well play its part in the confusion. Not to mention the ever-increasing mass of buzz words circling social media and internet forums. From Machine Learning, to Augmented or Artificial Intelligence (take your pick!) to Neural Networks, Random Forests, Hadoop, Spark and Cognitive, it’s no surprise that analytics and clarity are not thought of hand in hand.
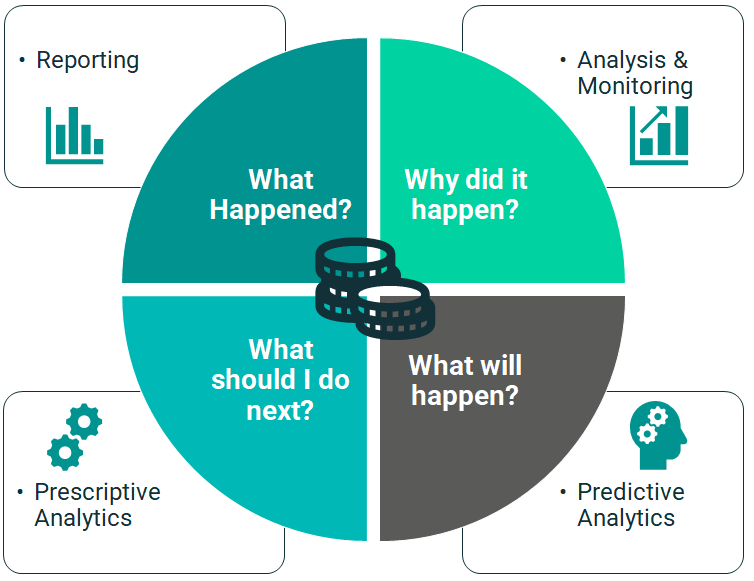
The questions answered with analytics?
When you consider the key questions that analytics seeks to address for organisations, it can often be broken down to specific usage.
The first example is provision of information in a (hopefully) clear and concise way.
What Happened?
Here the focus is on getting a look at information (descriptive analytics) and the onus is on the individual(s)/consumer(s) to make decisions. A report is created and distributed – or indeed made available online – and reflects useful groupings or representations designed to assist in understanding.
The next level on from this is to consider – Why did it happen?
This is akin to a root cause analysis (diagnostic analytics) that digs a little deeper. Usually it is directed by business expertise and experience of previous situations. The outcome in this sense is more clearly defined. There may have been an issue, but now the analytics has painted a picture of the root cause and therefore what needs to done about it is easily inferred. Of course, naturally, there is the odd misleading scenario, and this is where we rely on the business expertise or perhaps the story telling prowess of the analyst to ensure that the picture painted is the correct one!
Both these scenarios can be considered classical Business Intelligence. This is often described as the ‘Rear View’ variety of analytics. The onus here is on the person reviewing the analytics to make conclusions based on the past about what to do now and in the future. There is a level of uncertainty in this. How can you be sure that history will repeat itself?
How can you know what will happen?
This is exactly where predictive analytics comes in. The event, patterns, and root causes of the past are related to events and the level of certainty is estimated with a probability. Interestingly the techniques used for diagnostic and predictive analytics don’t differ hugely, except for the target outcome. To address the ‘what will happen’ question, the onus shifts to the analytics to make a sensible recommendation independent and objective to the business expert – evidence based decision making. Such techniques are common place now to identify target customers who are likely to purchase or to flag insurance claims or transactions as fraudulent.
Unsurprisingly, firstly analytics and secondly business trust have more recently matured to the next level, where the analytics makes a recommendation based on those probabilities and then implements the most sensible action under any constraints.
Termed prescriptive analytics, the approach is to answer what should I do next?
The level of human interaction is reduced even further, and the applications extend to optimisation of workforce schedules or next best offers in marketing campaigns. In truth, the level of complexity in analytics is increasing each time and the depth to which an answer is provided is increased too.
At Version 1, we advise customers to understand the questions that you want to answer is the first step, and this should lead quite naturally to the type of analytics and then to the techniques themselves. Each area is of equally critical importance to achieving business benefits, rarely exclusively and as appropriate for the business problem.

This should highlight clarity of understanding rather than the analytical complexity. Anything above the line though, fits the Business Intelligence bill. Anything below the line is considered Advanced Analytics and includes a probability or representation of a future event or situation. There is no inherent ranking or relative importance. In this context, the complexity of the techniques differ (it increases as you move clockwise) but it is worth asking – why make something more complicated than it needs to be?
Version 1’s experienced consultants are on hand to help you understand your SPSS needs – from consultancy and training to finding the best software and license type for your analytical and usage requirements. Contact us to discuss your requirement and identify the best SPSS solution for you.
Related Articles
Take a look through our SPSS Articles covering a broad range of SPSS product and data analytics topics.


